In depth code analysis with NDepend
After using NDepend for a while to analyze a few codebases, I wrote this blog about my experience, which I can summarize by saying it’s a powerful tool that gives you a lot of insights into your codebase like complexity, dependencies, dead code, code smells, comparisons between versions, etc. Go ahead and check it out at the NDepend website with a free trial, you won’t regret it. Read on to get some of my experiences. Tip: Do make use of the extensive documentation!
About NDepend
The website of NDepend sums it up quite nicely: NDepend is a .NET tool that provides deep insight into code bases. The tool empowers developers, architects and executives to make intelligent decisions on projects. The community name it the “Swiss Army Knife” for .NET programmers.
I’ve used it to bring some objectivity to my analysis and opinion of legacy codebases, which helps when needing to convince management that a codebase needs some love.
Installation
Like many other software, leave your contact information to download NDepend. I don’t like this, but it’s not a big deal to me. Then just unzip the downloaded file into a directory, because if you want you can just use NDepend without installing anything, nice! You get a 14-day free evaluation to test NDepend, so it’s easy to give it a try.
At this point you have a few options:
- Fire up ‘VisualNDepend.exe’ to start a standalone analyzer.
- Run ‘NDepend.VisualStudioExtension.Installer.exe’ to create a nice integration with Visual Studio.
- Use ‘NDepend.Console.exe’ (which I didn’t do)
- Use ‘NDepend.PowerTools.exe’ (which I also didn’t do)
I started with VisualNDepend, because I didn’t want to install anything yet. Switched to the Visual Studio extension later. There is also good integration with Azure DevOps. More on this later. Too bad nothing is mentioned about GitHub in the docs, but you can probably get it working by using the console app.
VisualNDepend.exe
The home screen is clean. I get the feeling it’s a powerful tool based on all the menu options I see. This is also a bit of a downside. I found the learning curve a bit steeper than I’d expected. Had some issues navigating and finding out what is available. Luckily Patrick Smacchia is very helpful and gives you lots of material to study if you need any help. Many things are just documented in the NDepend documentation but of course we all try first without reading :)
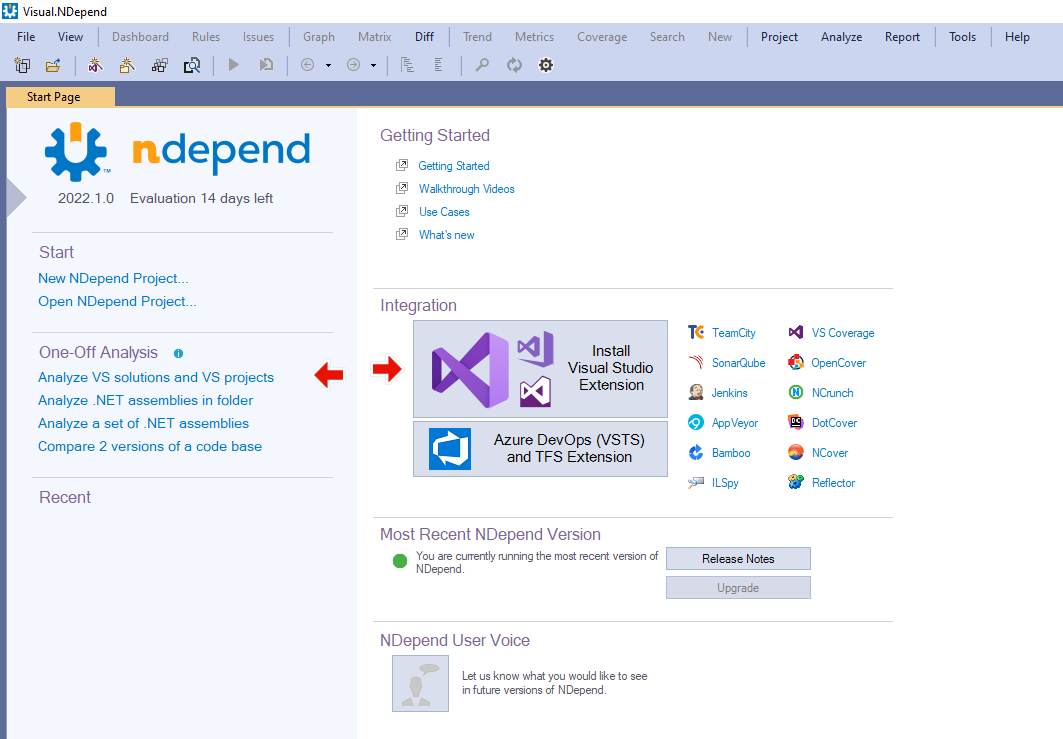
Nice to see all the integration options as well. Most important for my work are the following, but there are many others:
- Visual Studio
- SonarQube
- Azure DevOps
Straight off clicked on ‘Analyze VS solutions and VS projects’, which shows me all recent solutions I opened in Visual Studio. Clicked my favorite solution and then a bit of ‘next-next-finish’ to just get a sense of what NDepend could tell me.
First impression of initial analysis
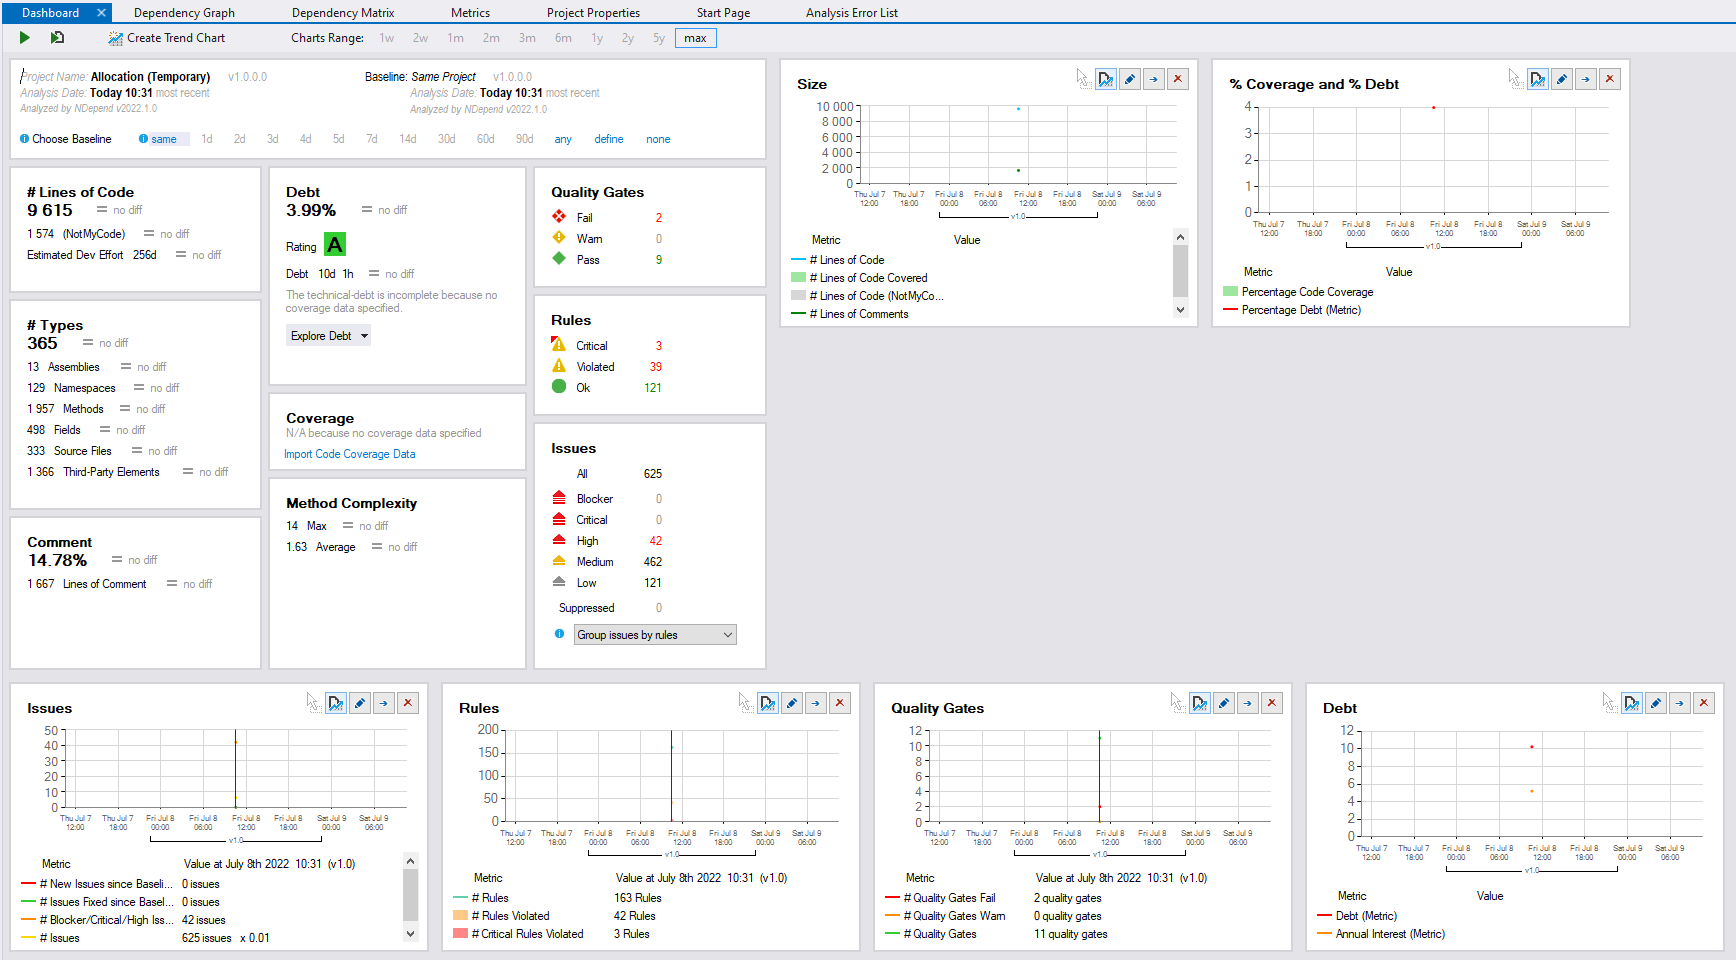
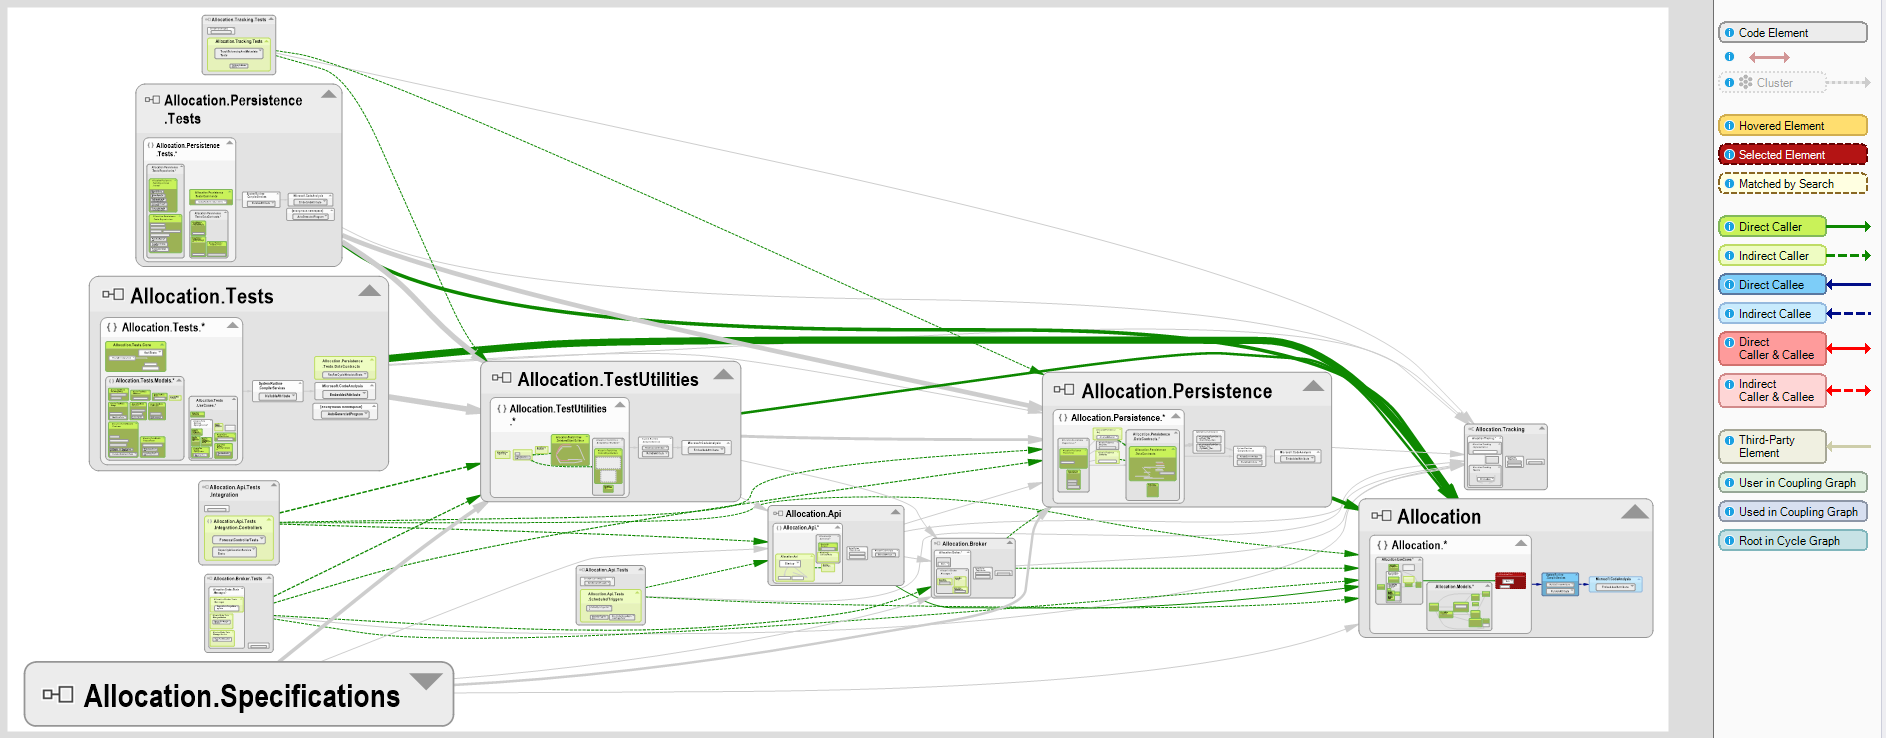
Wow. Many things to see. Above the dashboard are tabs to see other information. I clicked ‘Dependency Graph’ as I recently had to figure out how another solution was structured, and this would have been useful. Of course, you can generate this in Visual Studio as well but not everyone uses that or has access to the Enterprise edition. The graph looks like this when collapsed:
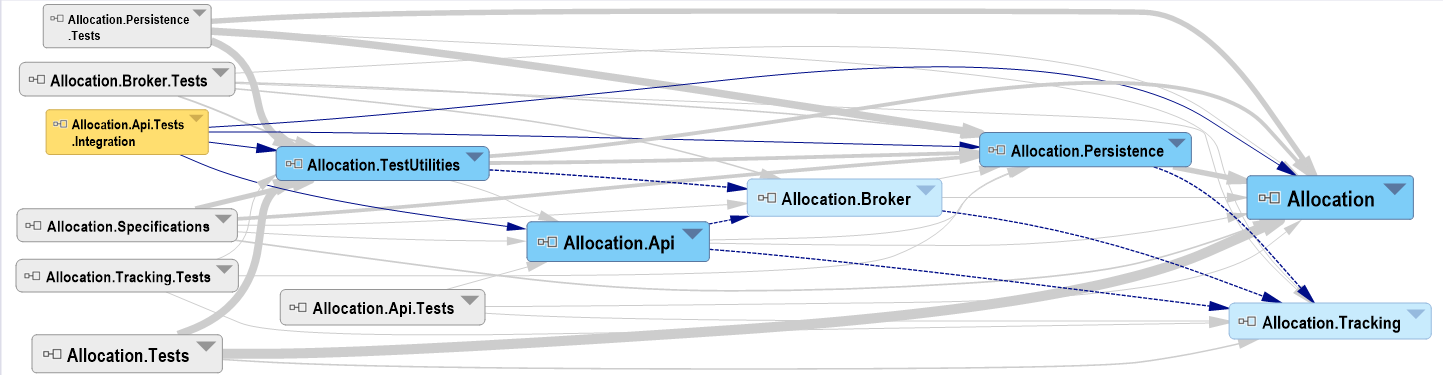
You can also expand things, select elements and get more detailed information on for instance the direction of the dependencies:
Usability
Alright! Looking good but I don’t care about the test projects, so how do I get rid of those? This is where I started struggling a bit more and where the tool could be a bit more intuitive for me. Clicked on a button called ‘assemblies’, giving me the same graph but with a query editor to the left so I guess I was already looking at all the assemblies. Rewrote the LINQ query, pressed save and nothing happened. Also, I can’t find where exactly that query is saved. Or did I just overwrite the default ‘assemblies’ query?
Messed around a bit more and finally clicked ‘Export to graph’ which did what I wanted! A little later I also found out I could just remove elements by click on them and using one of the new buttons that appear. Before selecting an element:
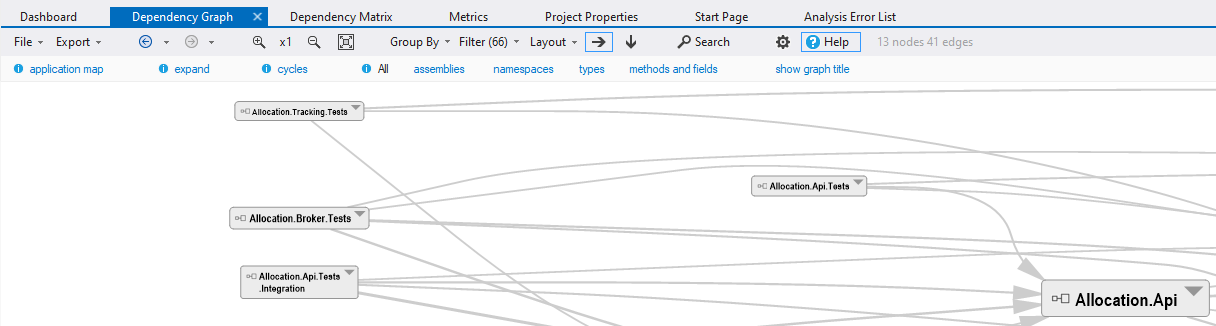
After selecting an element:
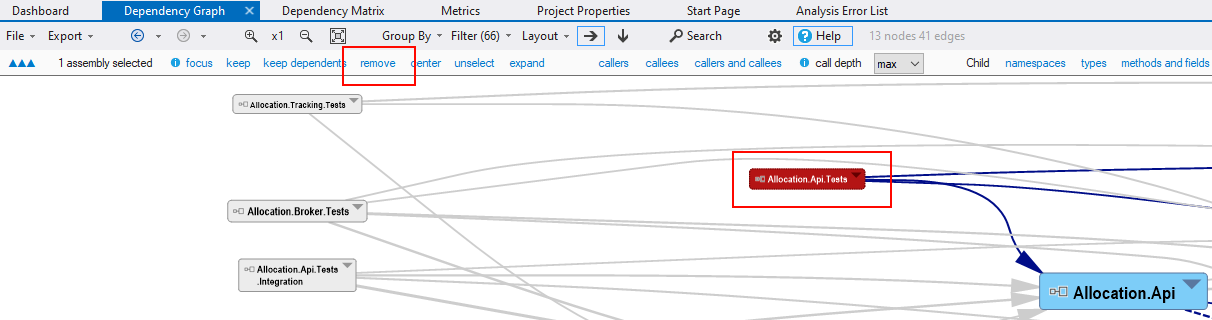
Would be great if I could just do a right mouse click on the element and immediately click remove from the context menu. There is so much to see and do. I think it’s a great tool, but it can be a bit much and unclear what to do. I guess that is what you get when not using the documentation ;)
Next up I wondered if NDepend could tell me if there was any code that dead.
Finding dead code (or any other code with issues)
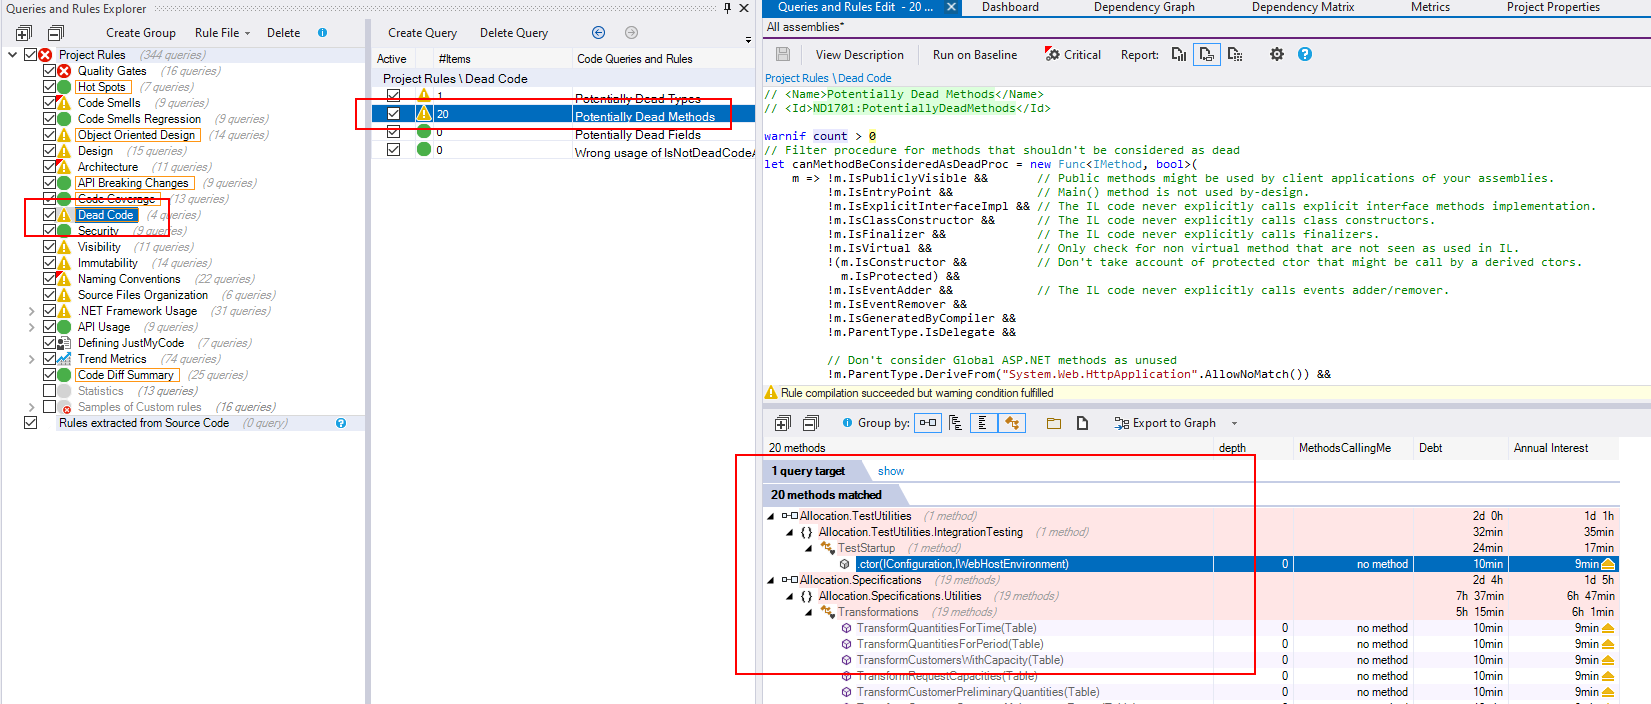
There are many built-in rules in NDepend. You can just click on one of them and view the query and the results. From the results you can start new queries, add elements to the dependency graph and do much more. One of the rules is the ‘Dead Code’ rule which has 4 queries underneath showing you potentially dead code. In the screenshot below they were all false positives, but in another project it allowed the customer to remove a whole bunch of classes, which is great.
Visual Studio integration
Just run the NDepend.VisualStudioExtension.Installer executable and integration works immediately. It’s basically the Visual NDepend tool but with the look and feel of Visual Studio. The main advantage I noticed was easier navigation to code that has issues and not having to run a separate tool.
Results are stored in an ‘NDependOut’ folder with an accompanying ‘ndproj’ file that allows you to open the results later to continue. Or to run multiple analysis over time allowing you to see how things are evolving. Great stuff!
Integrating in an Azure DevOps pipeline
Just like the Visual Studio integration, this is straightforward. Just install the Azure DevOps plugin from the Marketplace. Add a license or request a trial and add a single step to your pipeline:
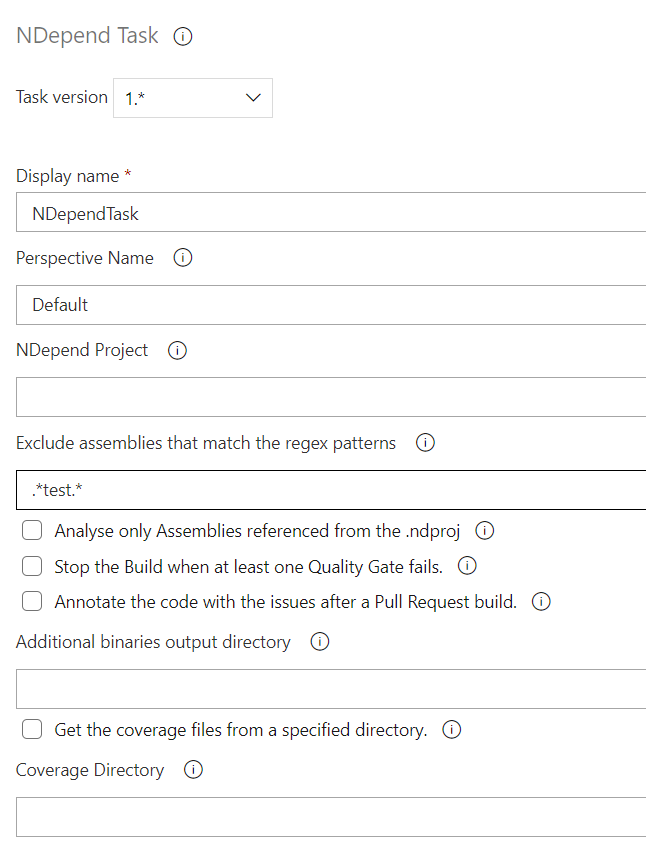
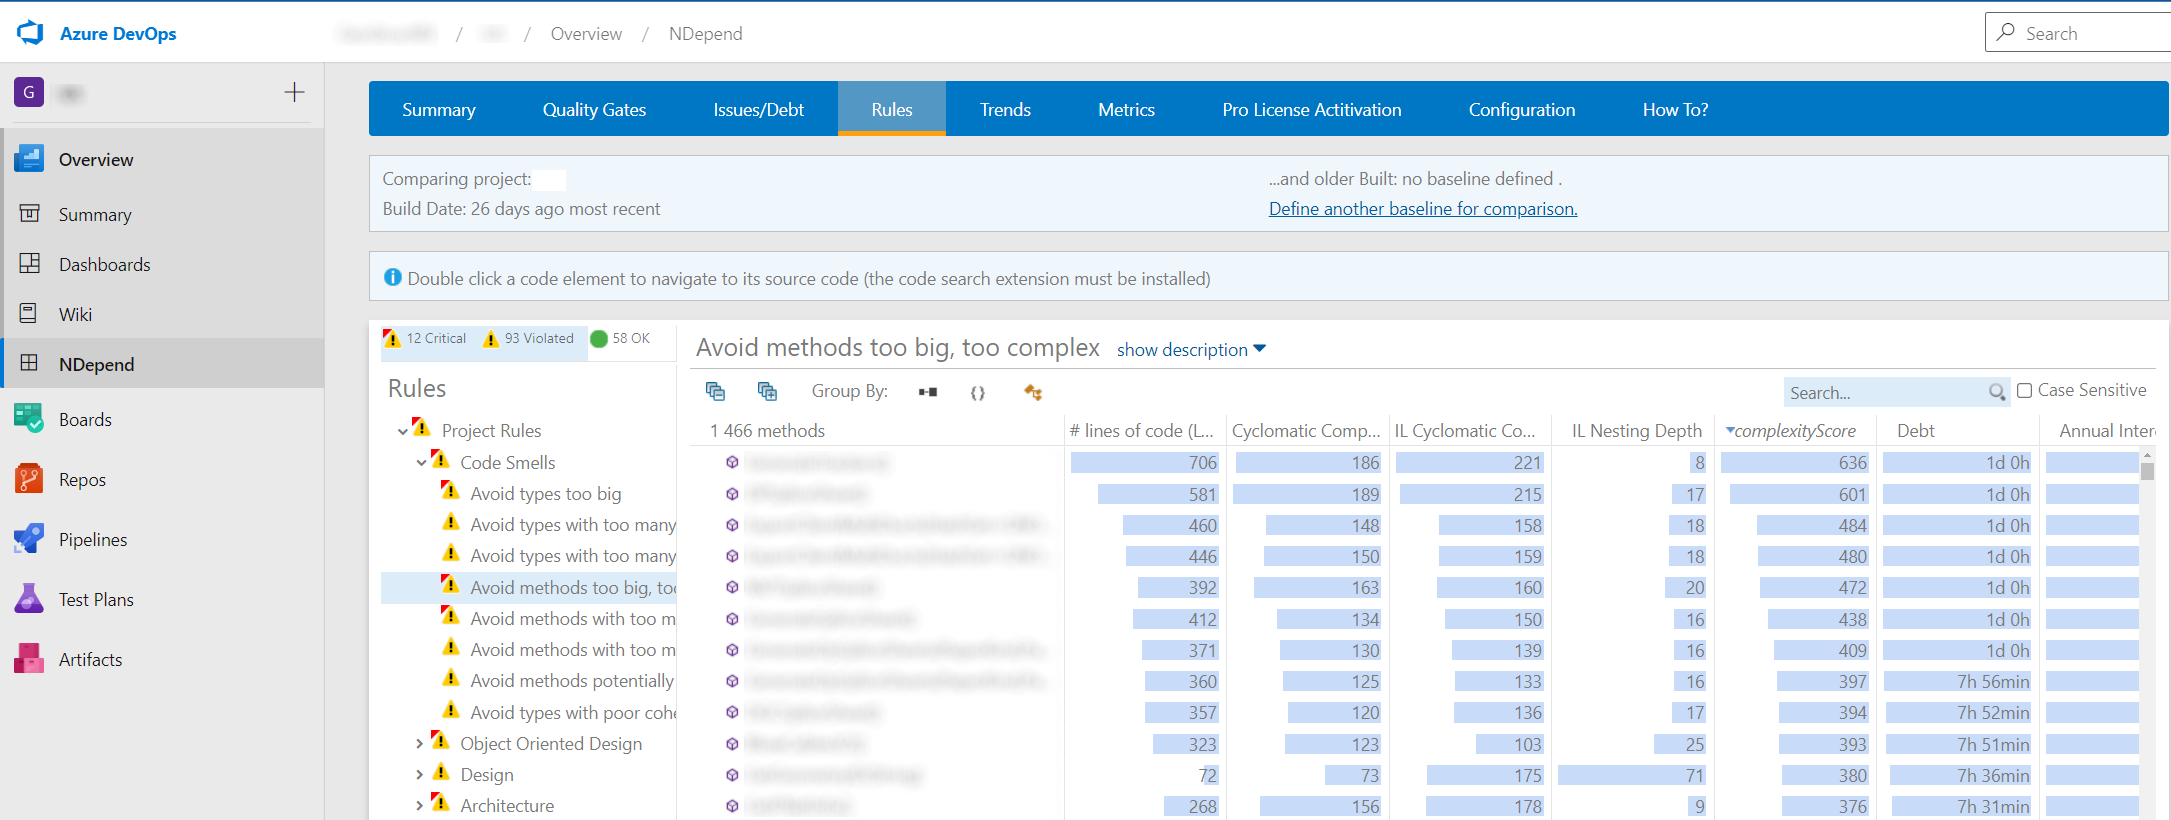
After running the pipeline, you get a nice dashboard. Just like in Visual Studio, if you run the pipeline multiple times you get a nice overview of the differences compared to a baseline:
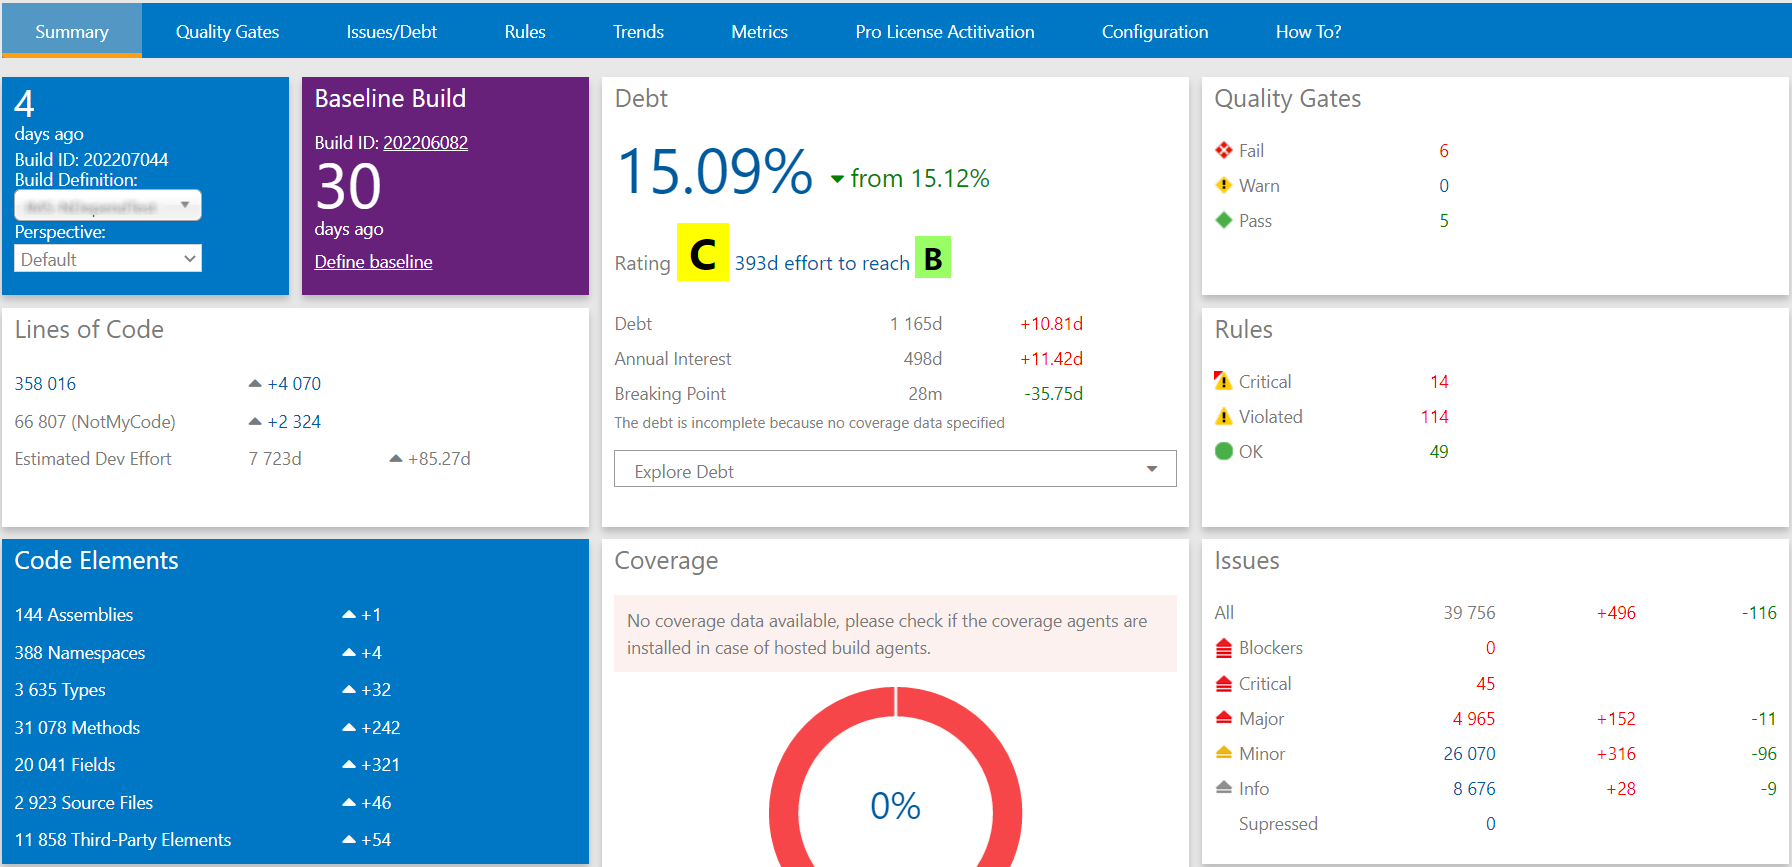
In the screenshot above: 242 new methods in 30 days, 496 new code smells (and 116 removed) and almost 11 days of new technical debt. Things are not improving over time.
How I used all of this
I got asked to advice on how to best proceed with some software that has grown over the last 10+ years and evolved (according to the developers) into a big messy spaghetti with a lot of issues like bad performance, regression issues and parts of the code they didn’t dare to change. Management however thought it was just fine. After having a look at the codebase, I quickly agreed with the developers and architect. To have some objectivity besides all our opinions I decided to have them run SonarCloud and NDepend. Both tools gave the same indications: The code is full of smells and too big and too complex and doesn’t have any tests. NDepend gave me more details here compared to SonarCloud, allowing me to ask follow-up questions better. I haven’t used NDepend during development, so can’t tell how things with analysis of Pull Requests for instance.
The results of these tools, the opinion of the team and my opinion as external consultant combined was enough to convince the customer that things need to improve.
Disclaimer
In order to write this blogpost, I received a temporary license from NDepend, so I could run NDepend for a bit longer than the standard 14 day evaluation. For the Azure DevOps part a separate license was needed. There I just used the trial license.