Creating an Azure DevOps pipeline for .NET Core with multiple test projects, SonarQube, ReportGenerator & more
Update: A followup blogpost improving on this pipeline is available here!
After having to configure another pipeline at a customer for a .NET Core project with multiple test projects and wanting test results and code coverage nicely visible in both Azure DevOps and SonarQube, I decided it was time to write the whole thing down for others to use. While there are some really nice blogposts out there all dealing with parts of what I wanted (like this one or this one or this one by my colleague Niels Nijveldt), I didn’t find one that combined all of it, so here we are.
Disclaimer: All of this was written at 30/9/2019, possibly things changed since then. Use this as a quickstart/reference but do look if you can find more actual / easier solutions. Also, all of this has been done with the classic pipelines in Azure Devops. Using pipelines as code shouldn’t change much and if you start from scratch I recommend you go for the YAML solution, keep the definition next to your sourcecode and treat it as such.
1. Basic setup
All tasks mentioned here and in the rest of this post are put in a taskgroup for easy re-use, because of customer preference. You can decide for yourself if you like this or not. The four basic tasks are using the dotnet tool to build, test and publish the code:
- dotnet restore
- dotnet build
- dotnet test
- dotnet publish
All have a parameter to specify which projects the command should run for:
- dotnet restore:
**/*.csproj - dotnet build:
**/*.csproj - dotnet test:
**/*Tests*.csproj - dotnet publish:
**/$(WebProjectName).csproj. WebProjectName is a parameter to the taskgroup and should be filled with the name of your webproject.
Most of these commands also execute the previous steps by default, so a small optimization was done by adding some extra parameters:
- dotnet restore: no extra parameters
- dotnet build:
--no-restore - dotnet test:
--no-restore --no-build - dotnet publish
--no-restore --no-build(–no-test doesn’t exist because tests aren’t being run automatically)
No-build and no-restore do what you expect and although it won’t actually restore or build multiple times, these parameters do save a few seconds every build. Additionally, all tasks have had the parameter --configuration $(Configuration) added. Configuration is also a parameter to the taskgroup which allows you to specify Debug or Release mode.
2. Getting test results from your code
This is the simplest change to the basic setup:
- dotnet test got 2 additional parameters:
--logger trx --results-directory $(TestOutputDirectory) - A new task was added to the taskgroup: “Publish Test Results” with parameter “Test Result File(s)” set to:
$(TestOutputDirectory)/*.trx
–logger trx writes TRX files in the results directory. These files contain the tests run and their results. TestOutputDirectory is again a parameter to the taskgroup. Not because we really need it to be a parameter, but because we reuse the value a bunch of times and taskgroups don’t allow you to define a variable. At the customer we originally set this to “$(Agent.TempDirectory)/testresults”, but later changed it to “$(Build.SourcesDirectory)/testresults” and added an extra task to clean this directory on each build, because for some reason SonarQube analysis was taking up more than 1 hour when using the temp directory. Left these steps out of this guide, as I’m not sure what the rootcause was.
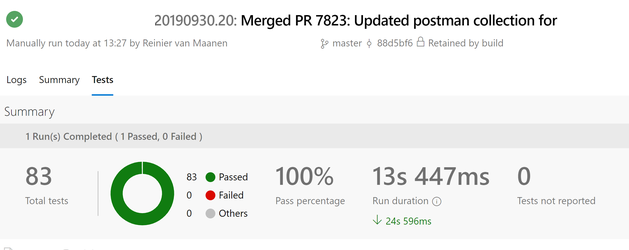
The new task publishes the test results to Azure DevOps so they are linked to the current build and can be seen if you open the build and click on ‘Tests’. You might know there is also a “Publish test results and code coverage” option in the dotnet test task, but we don’t want to publish the code coverage results in the pipeline at this moment because we have multiple test projects and want to merge results.
At this point things should look like the image below. Small remark for those wondering why its taking 13 seconds: there are also ASP.NET Core integration tests being run in the pipeline.
3. Getting code coverage from your code
A number of things have been done to get code coverage working:
- NuGet package coverlet.collector was added to all test projects. If you create a new xUnit .NET Core testproject with VS you actually get this package pre-installed by the template.
- dotnet test got an additional parameter:
--collect:"XPlat Code Coverage"
Coverlet is a tool which gives you the option to create code coverage files in multiple formats and isn’t dependent on the OS. The –collect parameter instructs dotnet test to create code coverage files with Coverlet. By default this will be a coverage file in the format of Cobertura. It will be written in a subdirectory of the results-directory as specified in step 2.
Now at this moment you have a choice. If you have only 1 project containing tests and you don’t want a fancy coverage dashboad in Azure Devops or SonarQube, you can immediately put in the standard “Publish Code Coverage” task and configure it to point to your single Cobertura coverage file (or go back and use the “Publish test results and code coverage” option in the test task). However as we have multiple test projects, want to use SonarQube and want a fancy dashboard visible in Azure DevOps, we’ll go with a slightly more complicated build:
- Add another parameter to the dotnet test task:
--settings $(Build.SourcesDirectory)/coverlet.runsettings - Add 3rd party task ReportGenerator to the taskgroup and configure it:
- Reports:
$(TestOutputDirectory)/*/coverage.opencover.xml. Be aware of the extra /* compared to the TRX path used in step 2! - Target Directory:
$(TestOutputDirectory)/mergedcoveragereport - Report Types:
HtmlInline_AzurePipelines;Cobertura - Assembly Filters:
-xunit*. Done to filter out xunit assemblies, add your own if you get coverage on anything unwanted.
- Reports:
- Add task Publish Code Coverage after the ReportGenerator and configure it:
- Summary file:
$(TestOutputDirectory)/mergedcoveragereport/Cobertura.xml - Report directory:
$(TestOutputDirectory)/mergedcoveragereport
- Summary file:
- Set variable
disable.coverage.autogenerate=truein your build pipeline to stop the “Publish Code Coverage” task from generating and overriding files generated by ReportGenerator.
The extra parameter for dotnet test points to a runsettings file which is part of the codebase and looks like this:
<?xml version="1.0" encoding="utf-8" ?>
<RunSettings>
  <DataCollectionRunSettings>
    <DataCollectors>
      <DataCollector friendlyName="XPlat code coverage">
        <Configuration>
          <Format>opencover</Format>
        </Configuration>
      </DataCollector>
    </DataCollectors>
  </DataCollectionRunSettings>
</RunSettings>
It tells Coverlet to output the coverage files in the opencover format, because we need that for SonarQube support in step 4. On this page you can view all supported formats. You can also customize a number of other things as well with Coverlet, have a look at the documentation. Already questions are being asked if there is also a way to change the format without a runsettings file and currently it is not. According to an answer to this GitHub issue something on the VSTest side needs to change.
The ReportGenerator task will do a couple of things:
- Load all OpenCover coverage files
- Output a single Cobertura.xml file with all coverage combined. You can output a to lot of different formats, making this a nice tool to merge/convert coverage files.
- Output a HTML page with all code coverage visualized.
The HTML report will be visible in the build after the Publish Code Coverage task has completed. The build results should have a code coverage section now, looking like this:
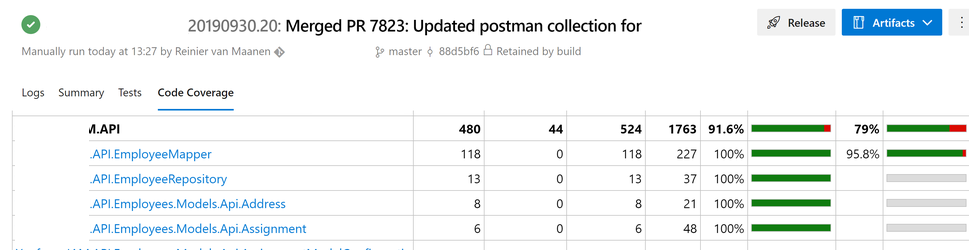
PS: If you run into errors when getting code coverage with coverlet, make sure you have the correct version of the .NET Core SDK installed on the build server. You can do that from the taskgroup by adding the task “Use .NET Core”.
4. Getting things visible in SonarQube
Four new tasks have to be added to the build. They’re all provided by SonarQube. Somewhere before the build/test steps add:
- Prepare Analysis Configuration and name it “Prepare analysis on SonarQube for master branch”. Supply the mandatory parameters and add the following:
- Addition properties (under Advanced settings):
sonar.branch.name=$(Build.SourceBranchName)sonar.cs.vstest.reportsPaths=$(TestOutputDirectory)/*.trxsonar.cs.opencover.reportsPaths=$(TestOutputDirectory)/*/coverage.opencover.xml
- Run task under custom conditions (under Control Options):
and(succeeded(), ne(variables['Build.Reason'], 'PullRequest'))
- Addition properties (under Advanced settings):
- Prepare Analysis Configuration and name it “Prepare analysis on SonarQube for PR”
- Addition properties (under Advanced settings):
sonar.pullrequest.key=$(Build.BuildNumber)sonar.pullrequest.branch=$(Build.SourceBranchName)sonar.cs.vstest.reportsPaths=$(TestOutputDirectory)/*.trxsonar.cs.opencover.reportsPaths=$(TestOutputDirectory)/*/coverage.opencover.xml
- Run task under custom conditions (under Control Options):
and(succeeded(), eq(variables['Build.Reason'], 'PullRequest'))
- Addition properties (under Advanced settings):
After the build/test steps add:
- Run Code Analysis
- Publish Quality Gate Result
- Additionally you can add a PowerShell task to validate the Quality Gate in SonarQube with something along these lines:
# Check Quality gate#
$uri = "http://sonarqube.yourorg.nl/api/qualitygates/project_status?projectKey=$Env:SonarProjectKey"
$response = Invoke-RestMethod -Uri $uri
$status = $response.projectStatus.status
Write-Host "Quality gate status : $status"
if ($status.Equals("ERROR")) {
  Write-Host "##vso[task.complete result=Failed;] Quality gate FAILED. Please see the summary in SQ."
  Write-Host $response.projectstatus.conditions
  Write-Host "http://sonarqube.yourorg.nl/dashboard?id=$Env:SonarProjectKey"
  Write-Host $uri
  Write-Host (Get-Date)
}
else
{
 Write-Host "Quality gate PASSED"
}
A nicer way of doing this is by installing the task SonarQube Build Breaker and using that instead of PowerShell.
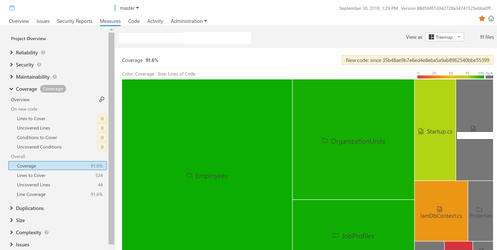
Screenshot of SonarQube showing one of the many ways to visualize coverage:
5. Small optimization for PR build duration
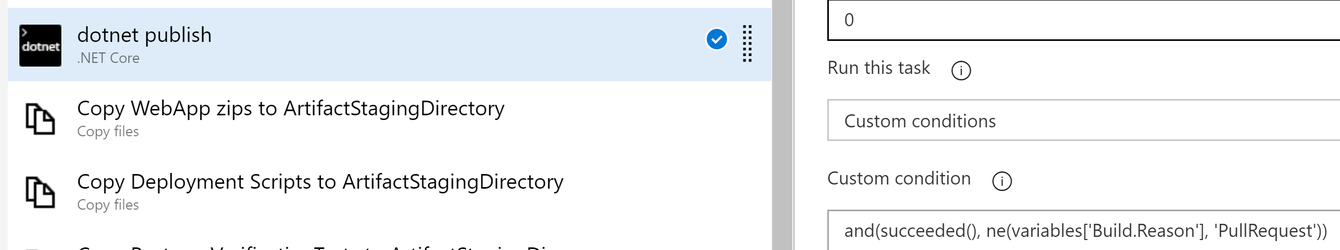
A few of the tasks have to do with publishing the web project, copying files to the artifact staging directory and publishing build artifacts. These can be disabled for faster Pull Request builds by going into the task and opening up the section ‘Control Options’. Here you can set the task to run under custom conditions and you can enter something like and(succeeded(), ne(variables['Build.Reason'], 'PullRequest')). This will make sure this tasks gets only executed when these 2 things are true:
- All previous build steps have succeeded
- The build reason variable does not equal (ne) PullRequest, so it’s a release build.
In the taskgroup the following tasks are skipped when doing a PR build:
- dotnet publish
- Copy WebApp zips to ArtifactStagingDirectory
- Copy Deployment Scripts to ArtifactStagingDirectory
- Copy PostmanVerificationTests to ArtifactStagingDirectory
- Publish Artifact: drop
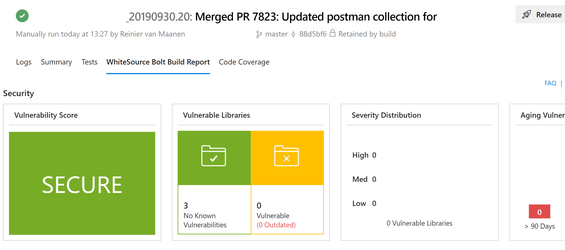
6. Scanning for outdated/vulnerable NuGet packages
Bonus: You can add the WhiteSource Bolt task to the pipeline, which will show you outdated and vulnerable NuGet dependencies as well as using certain type of licenses. Not really related to code coverage, but nice to have and easy to do:
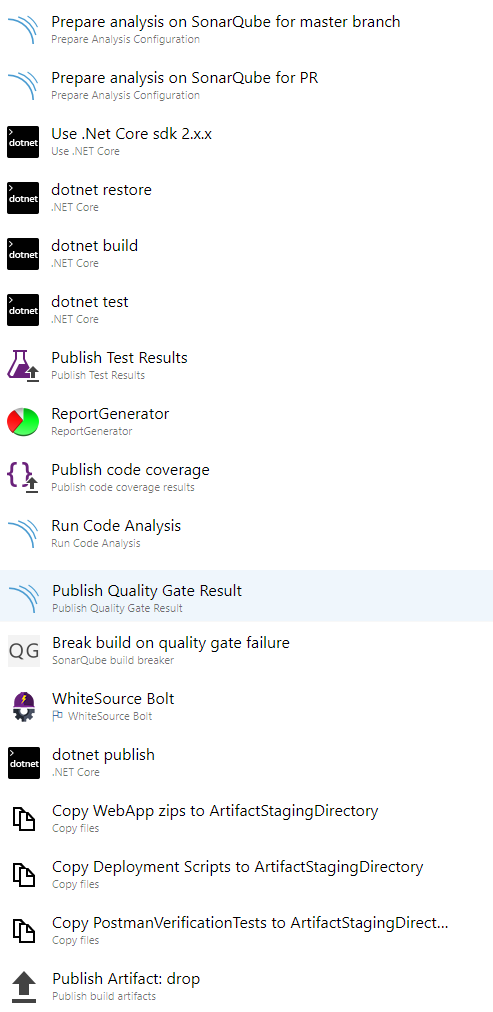
7. Final pipeline
The final pipeline for the project is actually a call to a single taskgroup, easy to reuse and boring to show. The taskgroup being called looks like this: